Ease of Movement (EOM)
What Ease of Movement measures, how distance and volume enter it, why its scale differs by symbol, its settings on MillionChart and an example on gold.
Ease of Movement measures how easily price moves: how far the candle's midpoint travelled for the volume it took. A large positive value is price rising on little volume; a large negative value is price falling easily; near zero, price needed a lot of volume to move, or did not move. Richard W. Arms Jr. devised it. It has no fixed range: its scale depends on the symbol.
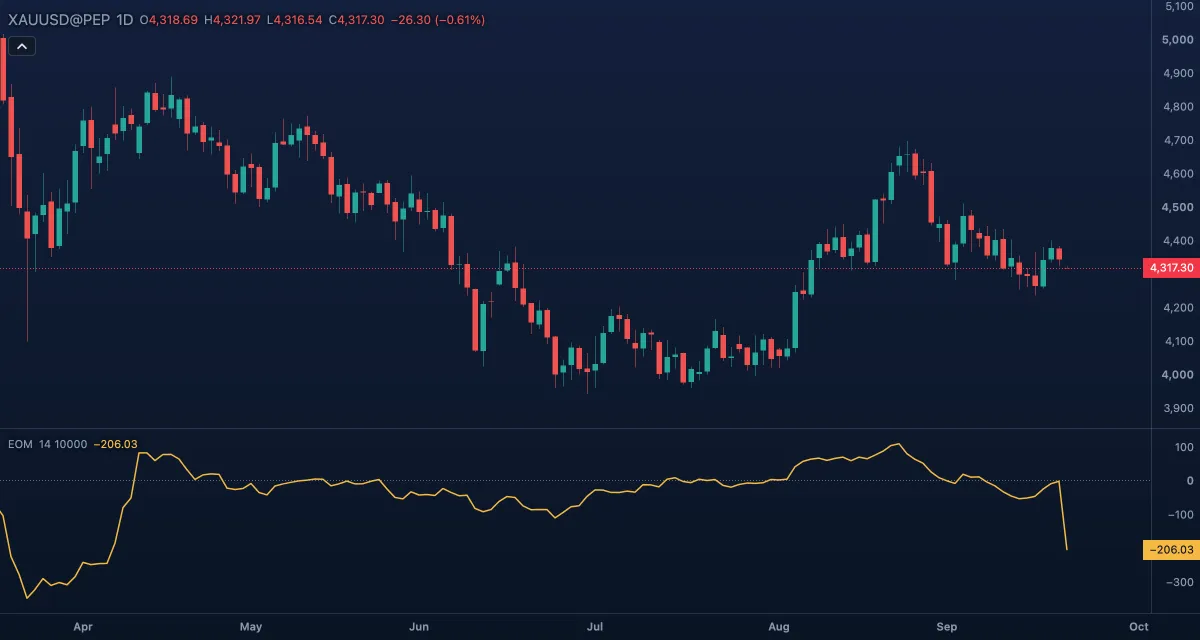
What it shows#
- EOM — a gold line in its own pane: the 14-candle average of the one-candle ease value. Above zero, price has been moving up easily; below zero, down easily. The further from zero, the less volume each unit of movement cost.
- Zero — a dotted line; crossings of it are the usual reading.
- The scale is not fixed: with the default divisor the value sits in the tens on gold and in the hundreds on an index such as US30, so compare the line with its own past.
How it is calculated#
For each candle, distance = the midpoint (high + low) / 2 minus the previous candle's midpoint, and the box ratio = (volume / Volume divisor) / (high − low), the volume it took per unit of range. The one-candle value is distance / box ratio; EOM is its simple moving average over Length candles. A candle whose high equals its low gives 0; a candle with no volume has no value and restarts the average.
How traders use it#
- Zero crossings: EOM turning positive after a stretch below zero says price has begun to rise with little resistance; turning negative, the reverse. It confirms a move that has started; it does not forecast one.
- Trend filter: a long run above zero supports staying with an uptrend; a slide toward zero while price still rises warns that each gain is costing more volume.
- Extremes: a spike far from zero often comes at the end of a quick move, and a pause usually follows.
- Watch out for: the average lags by about half its length; low-volume candles throw the value around; on a major currency pair the default value reads near 0.0000001 — raise Volume divisor (10,000,000,000 brings hourly EURUSD to tenths). On gold the volume is tick volume.
Settings#
| Setting | Default | What it changes |
|---|---|---|
| Length | 14 | Candles in the moving average; shorter is faster and noisier. |
| Volume divisor | 10000 | Divides the volume before the box ratio; it only rescales the line (ten times the divisor, ten times the value). From a million up the legend prints it as 1e10. |
| Colours and style | — | EOM (the line) and Zero line; width and visibility under Lines in the Inspector. |
Example on gold#
Suppose gold on daily candles has drifted down from $4,350 to $4,280 over three weeks with EOM below zero the whole way. Then price turns with two wide up candles on ordinary volume, and a few days later EOM crosses above zero. For example, a trader reads this as the fall having lost its ease and the rise coming cheaply, and looks for a long on a pullback that holds above $4,280, with the stop under that low.
What invalidates it: EOM dropping back below zero within a few candles, or price rising on tall volume columns while EOM stays flat near zero — the move is then being bought at a cost, the opposite of easy.
Add it to your chart#
- Click Indicators in the top strip (on the Pro screen, press I).
- Type
eomand click Ease of Movement, or press Enter for the first result. - Click its chip in the legend to open the Inspector and change the settings; drag the chip to reorder; the dot hides it; × removes it.
Related#
- Volume — the columns the box ratio divides by
- Elder Force Index — price change times volume, the complementary question
- Price Volume Trend — volume weighted by the relative price change, added up
- Alerts — an alert when the value crosses zero
- Adding and tuning indicators