Percentage Price Oscillator (PPO)
What PPO measures, how it differs from MACD, how to read its histogram and signal line, its settings on MillionChart and an example on gold.
The Percentage Price Oscillator measures the gap between a fast and a slow exponential moving average as a percentage of the slow one. It is MACD expressed in percent, which lets you compare readings across symbols and price levels. Gerald Appel's MACD settings of 12, 26 and 9 are the defaults. It swings around zero in its own pane.
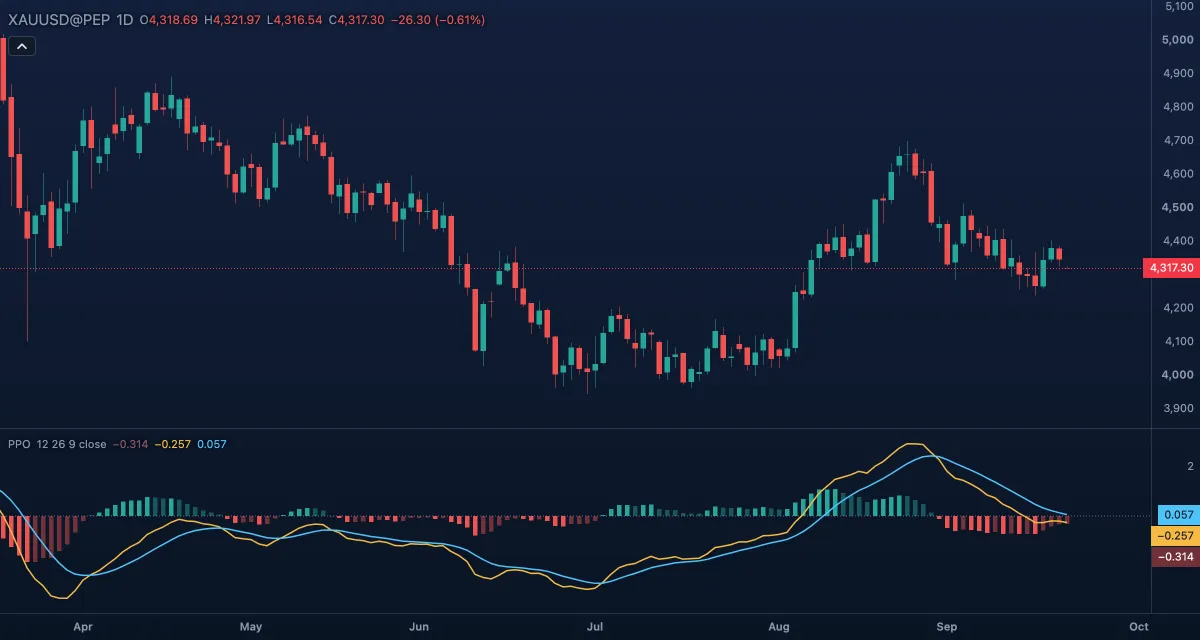
What it shows#
- PPO (gold line): the fast EMA minus the slow EMA, as a percent of the slow EMA. Above zero the fast average is above the slow one; below zero the opposite.
- Signal (blue line): a 9-bar EMA of the PPO line, smoother and later.
- Histogram: PPO minus Signal. Green above zero, red below. A bar is drawn solid while it grows away from zero and faded while it shrinks back toward it, so a fading histogram is visible before the lines cross.
- Zero: a dotted line at 0.
How it is calculated#
PPO = 100 × (EMA(source, Fast length) − EMA(source, Slow length)) / EMA(source, Slow length). The Signal line is an EMA of PPO over Signal length bars, and the histogram is PPO minus Signal. Source picks the price that enters the averages; by default the close. Because the gap is divided by the slow average, a reading of 1 means the fast average sits 1% above the slow one, on any symbol.
How traders use it#
- Zero line: PPO above zero is an uptrend bias (the short average leads the long one); a zero crossing is the two averages crossing.
- Signal crossings: PPO crossing above its signal line says momentum is turning up, below it turning down. The histogram crossing zero is the same event.
- A shrinking histogram warns that a move is losing speed before any crossing happens.
- Divergence: price makes a higher high while PPO makes a lower high, so the move is weaker than it looks. A warning, not a signal on its own.
- Comparison: a PPO of 2 means the same relative gap on any symbol; MACD values cannot be compared that way.
- Watch out for: it is built from moving averages and lags; in a sideways market the lines cross back and forth and most crossings fail. In a long trend PPO can stay on one side of zero for months.
Settings#
| Setting | Default | What it changes |
|---|---|---|
| Fast length | 12 | Bars of the fast EMA. Shorter reacts sooner and crosses more often. |
| Slow length | 26 | Bars of the slow EMA, the base of the percentage. |
| Signal length | 9 | Bars of the EMA of the PPO line. |
| Source | Close | The price the averages use: Open, High, Low, Close, Mid (HL2), Typical (HLC3) or Average (OHLC4). |
| Colours and style | — | The colours of the PPO and Signal lines, the four histogram states (above or below zero, rising or falling) and the zero line. |
Example on gold#
Suppose gold has climbed from about $4,100 to $4,300 over a few weeks on the daily chart, for example. PPO sits above zero and above its signal line, and the histogram is solid green: the trend has momentum. Price then stalls under $4,300 while the histogram bars shrink and turn faded green. That is the first warning. When PPO crosses below the signal line the histogram turns red: a trader using PPO for timing might tighten a stop or take part of a long position off, rather than short a trend that is still above zero. The warning is cancelled if PPO crosses back above the signal line.
Add it to your chart#
- Click Indicators in the top strip (on the Pro screen, press I).
- Type
ppoand click Percentage Price Oscillator. - Click its chip in the legend to open the Inspector and change the settings; drag the chip to reorder; the dot hides it; × removes it.
Related#
- MACD — the same lines in price units
- Rate of Change — momentum as a plain percent change
- Exponential Moving Average — the average PPO is built from
- Alerts — an alert when PPO crosses zero or its signal line
- Adding and tuning indicators