Relative Vigor Index (RVGI)
What the Relative Vigor Index measures, how to read its two lines, its settings on MillionChart and a worked example on gold.
The Relative Vigor Index (RVGI) compares where candles close with where they open, against how much they range: in a rising market candles tend to close above their open, in a falling one below. It is drawn in its own pane around a zero line and stays between −1 and +1, mostly within a few tenths of zero. John Ehlers published it in 2002.
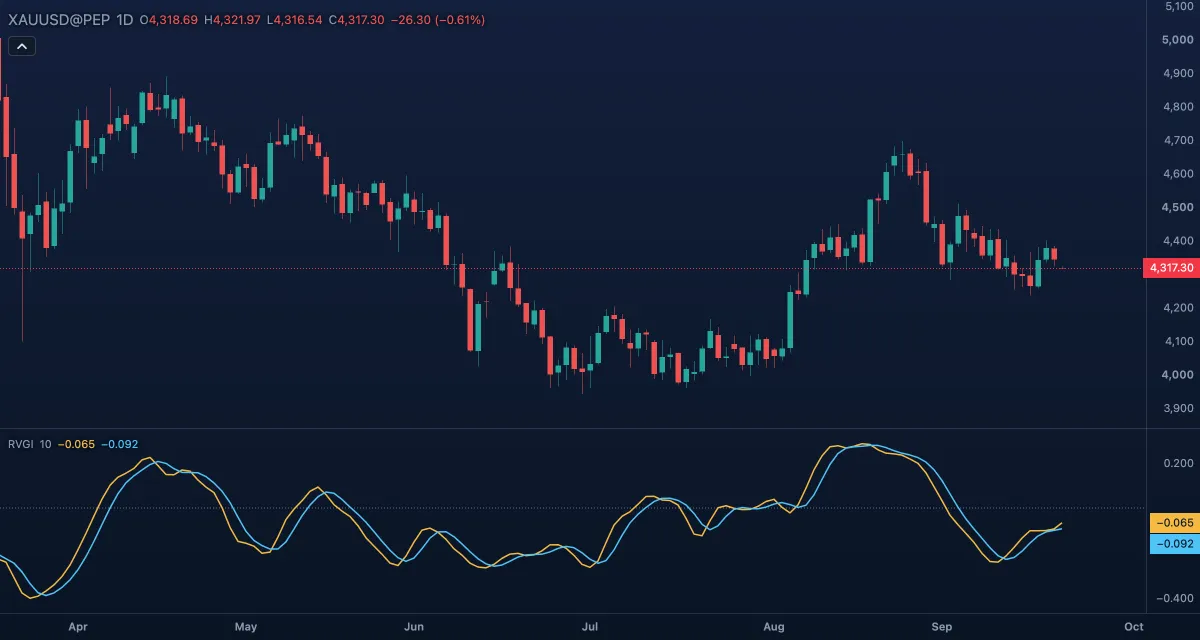
What it shows#
- RVI — the main line, in its own pane. Above zero the last bars closed above their opens on balance (buyers finished the bars), below zero they closed below; rising means that bias is growing.
- Signal — a four-bar weighted average of the RVI. It lags by a bar or two, so the lines cross a little after each turn.
- Zero — a dotted level at 0. Values are shown with three decimals, because the lines cross within hundredths.
How it is calculated#
For each bar the engine takes close − open and high − low, smooths both with Ehlers' symmetric four-bar weighting (1, 2, 2, 1, divided by 6) and sums each over the Length (10 bars). The RVI is the first sum divided by the second: the net close-to-open movement as a fraction of the total range. The Signal is the same four-bar weighting applied to the RVI. The indicator always uses the open, high, low and close; it has no source setting.
How traders use it#
- RVI crossing above its signal line is read as a bullish turn, crossing below as a bearish one; the crossings are frequent, so most traders take only those that agree with a longer timeframe's trend.
- Above zero supports a long bias, below zero a short bias; a cross of zero is a slower, cleaner confirmation.
- A higher high in price with a lower high in the RVI (or the reverse) is a divergence that warns the move is tiring.
- A longer Length gives fewer and later crossings.
- Watch out for: in a sideways market the two lines wind around each other and cross constantly, and a gap between one candle's close and the next open does not enter the calculation, since only the body and the range of each bar count.
Settings#
| Setting | Default | What it changes |
|---|---|---|
| Length | 10 | Bars over which the smoothed body and range are summed; longer is smoother and slower |
| Colours and style | — | The colours of the RVI and Signal lines and of the Zero line |
Example on gold#
Say gold has pulled back from $4,350 to $4,280 over a week of small daily candles and the RVI has drifted just below zero. The next three candles close near their highs; the RVI turns up and crosses above its signal line while still below zero. For example, a trader who expects the larger uptrend to continue could treat that cross as the first sign the pullback is over, and wait for a cross above zero before adding size. A fresh cross back below the signal line, or candles closing near their lows, would invalidate the idea.
Add it to your chart#
- Click Indicators in the top strip (on the Pro screen you can press I).
- Type
rvgiand click the indicator. - Click its chip in the legend to open the Inspector and change the settings; drag the chip to reorder; the dot hides it; × removes it.
Related#
- Balance of Power — the same close-minus-open idea, one bar at a time
- Fisher Transform — Ehlers' other oscillator, built from the position of price in its range
- Stochastic — where the close sits in the range of the last bars
- Alerts — an alert when the value crosses a level
- Adding and tuning indicators