Ulcer Index
What the Ulcer Index measures — the depth and length of drawdowns from recent highs — how to read it, its settings and an example on gold.
The Ulcer Index measures the pain of holding a position: how far, and for how long, the price has sat below its recent high. It counts only drawdowns — a rise above the old high adds nothing — so it is a measure of downside risk rather than of movement in both directions. It is in percent, and 0 means the close is at the highest close of its window. Peter Martin and Byron McCann published it in 1989.
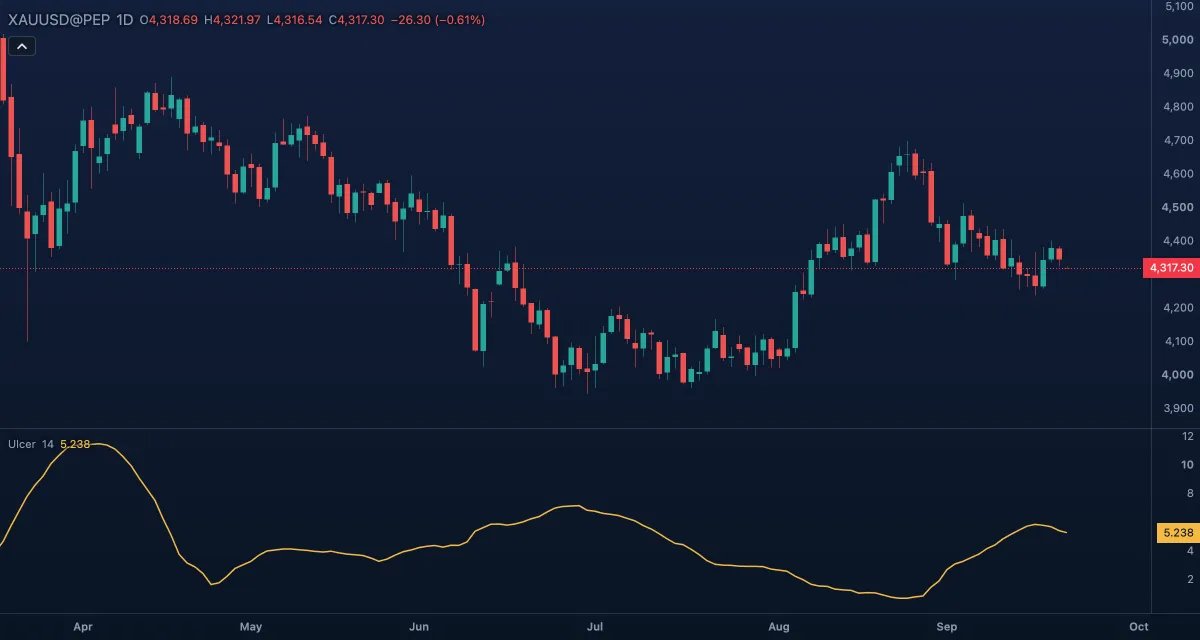
What it shows#
- UI — a line in its own pane, in percent, never below zero. It reads 0 while the close is at the highest close of the window, and higher the further the price has been below that high and the longer it has stayed there. Rising means a drawdown is deepening or persisting; falling back toward zero means the market is recovering to new highs.
- On intraday charts the values are fractions of a percent; the pane shows three decimals.
How it is calculated#
For each bar the indicator finds the highest close of the last Length bars and the percentage the current close sits below it: a drawdown, zero or negative. It squares these drawdowns, averages the last Length of them and takes the square root. Squaring makes a deep drawdown count much more than a shallow one; averaging over the window makes a long one count more than a brief dip.
How traders use it#
- As a risk gauge for a position you hold: a rising Ulcer Index says the drawdown is getting deeper or older — a point to review the stop or the size.
- To compare the ride of two symbols or two strategies: at equal returns, the one with the lower Ulcer Index gave less pain. The Ulcer Performance Index divides the excess return by it.
- In a healthy uptrend it stays near zero. A jump to its highest level in months after a long calm says the trend has broken, which is worth more than any single candle.
- It has no overbought side: a wild rally reads as zero risk, because the price is at its high.
- Watch out for: it measures the pain of a long only. For a short position the drawdown is the price rising above its recent low, and this indicator does not compute that. It is also slow to clear: old drawdowns stay in the average for a full window after the price has recovered.
Settings#
| Setting | Default | What it changes |
|---|---|---|
| Length | 14 | Bars for both the highest close and the averaging window. Longer is slower and weighs long drawdowns more. |
| Colours and style | — | The colour of the Ulcer index line. |
Example on gold#
For example, gold ran to $4,400 and then slid to $4,180 over three weeks, a drawdown of 5%. The Ulcer Index (14) climbed from near 0 to about 3, its highest reading of the year, while the moving averages still pointed up. A holder of a long takes the reading as a warning: the slide is deeper and longer than anything the trend has produced before, so the stop is moved up under $4,180 and part of the position is sold.
What would clear it: a close at a new high, say $4,420. That bar's drawdown is zero, and the index sinks back toward 0 over the next 14 bars as the old drawdowns leave the window.
Add it to your chart#
- Click Indicators in the top strip (on the Pro screen, press I).
- Type
ulcerand click Ulcer Index. - Click its chip in the legend to open the Inspector and change the settings; drag the chip to reorder; the dot hides it; × removes it.
Related#
- Historical Volatility — movement in both directions, annualised
- Average True Range — the size of the candles, the usual base for a stop
- Standard Deviation — the spread of the closes around their average
- Alerts — an alert when the value crosses a level
- Adding and tuning indicators