Klinger Volume Oscillator (KVO)
What the Klinger oscillator measures, its two methods and signal line, its settings on MillionChart and an example on gold.
The Klinger Volume Oscillator turns volume into a signed flow — positive when the candle's typical price rose, negative when it fell — and draws the difference of a fast and a slow exponential average of that flow, with a signal line. Positive values mean recent volume has leaned toward rising candles; negative, toward falling ones. Stephen J. Klinger published it in Technical Analysis of Stocks & Commodities in December 1997. It has no fixed range.
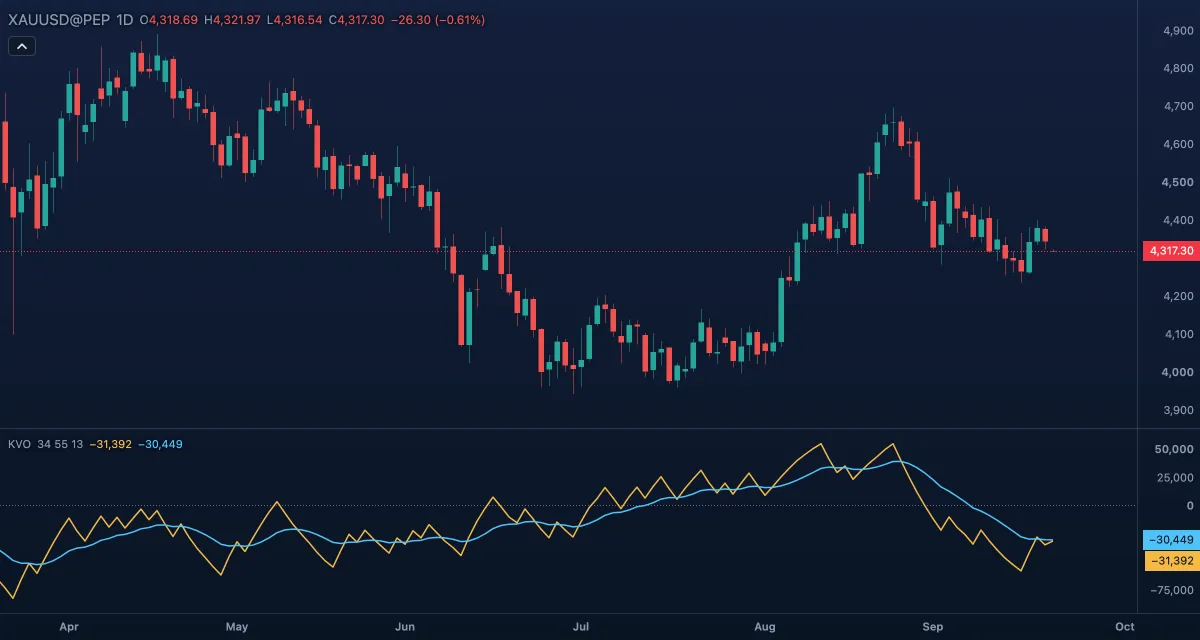
What it shows#
- KVO — a gold line in its own pane: EMA 34 minus EMA 55 of the signed volume. Above zero, the volume of the last few weeks has mostly come on rising candles; below zero, on falling ones. The slope matters more than the level.
- Signal — a light-blue line, the 13-candle EMA of KVO. KVO crossing above its signal is the usual bullish reading, below it the bearish one.
- Zero — a dotted line: the sign of the oscillator.
- The scale is in volume units without decimals; read crossings and divergences, not the numbers.
How it is calculated#
With the default method, Signed volume, each candle's volume is kept when the typical price (high + low + close) / 3 did not fall from the previous candle and negated when it fell. KVO = EMA(signed volume, Fast length) − EMA(signed volume, Slow length); the signal is EMA(KVO, Signal length). The Volume force (1997) method follows Klinger's article: the trend is +1 or −1 from the same comparison (a tie counts as −1), the candle's range is accumulated while the trend holds, and volume force = volume × |2 × (range / accumulated range − 1)| × trend × 100 goes into the same averages — in absolute value, because the term as printed is never positive and would reverse the trend's sign. The first value needs the slow length of candles (55); the signal line about a dozen more.
How traders use it#
- Signal crossings: KVO crossing up through the signal in an uptrend is a continuation reading; crossing down in a downtrend likewise. Crossings against the trend are weaker and more frequent.
- Zero line: a move from below to above zero says the balance of volume has shifted to rising candles, a slower confirmation of a trend change.
- Divergence: price makes a new high while KVO makes a lower high — volume is not following price, a caution for longs. The mirror at lows.
- Watch out for: it lags — the 34 and 55 averages react weeks after a turn on daily candles; in a range it crosses its signal often; the two methods can disagree, so do not switch methods mid-analysis. Tick volume on gold and forex.
Settings#
| Setting | Default | What it changes |
|---|---|---|
| Method | Signed volume | Signed volume is the short form most chart platforms draw. Volume force (1997) is Klinger's article form, with the range term; the legend adds force when it is chosen. |
| Fast length | 34 | The fast EMA of the flow. |
| Slow length | 55 | The slow EMA; the oscillator is fast minus slow. |
| Signal length | 13 | The EMA of the oscillator drawn as the signal line. |
| Colours and style | — | KVO, Signal and Zero line; widths and visibility under Lines in the Inspector. |
Example on gold#
Suppose gold on daily candles has trended up from $4,100 to $4,350 over two months with KVO above zero most of the way. Price then stalls; KVO slips under its signal and drifts toward zero while a pullback takes price to $4,300. For example, a trader waits for a KVO cross back above the signal with price holding $4,300 — the continuation reading for a long, with a stop under $4,290.
What invalidates it: KVO crossing below zero; or price making a new high above $4,350 while the KVO peak sits below its previous one — the advance is no longer carried by volume, and the trader does not chase it.
Add it to your chart#
- Click Indicators in the top strip (on the Pro screen, press I).
- Type
kvoand click Klinger Volume Oscillator, or press Enter for the first result. - Click its chip in the legend to open the Inspector and change the settings; drag the chip to reorder; the dot hides it; × removes it.
Related#
- On-Balance Volume — the simplest signed-volume line, with no smoothing
- Chaikin Oscillator — the same fast-minus-slow idea on the A/D line
- MACD — the same construction on price instead of volume
- Alerts — an alert when KVO crosses its signal or zero
- Adding and tuning indicators