Kaufman Adaptive Moving Average (KAMA)
What KAMA is, how it speeds up in trends and goes flat in ranges, its settings on MillionChart and a worked example on gold.
The Kaufman Adaptive Moving Average (KAMA) is a moving average that changes its own speed: it follows price closely when the market moves in a straight line and barely moves when the market is noisy. It is one line over the candles, in price units. Perry J. Kaufman published it in Smarter Trading (1995).
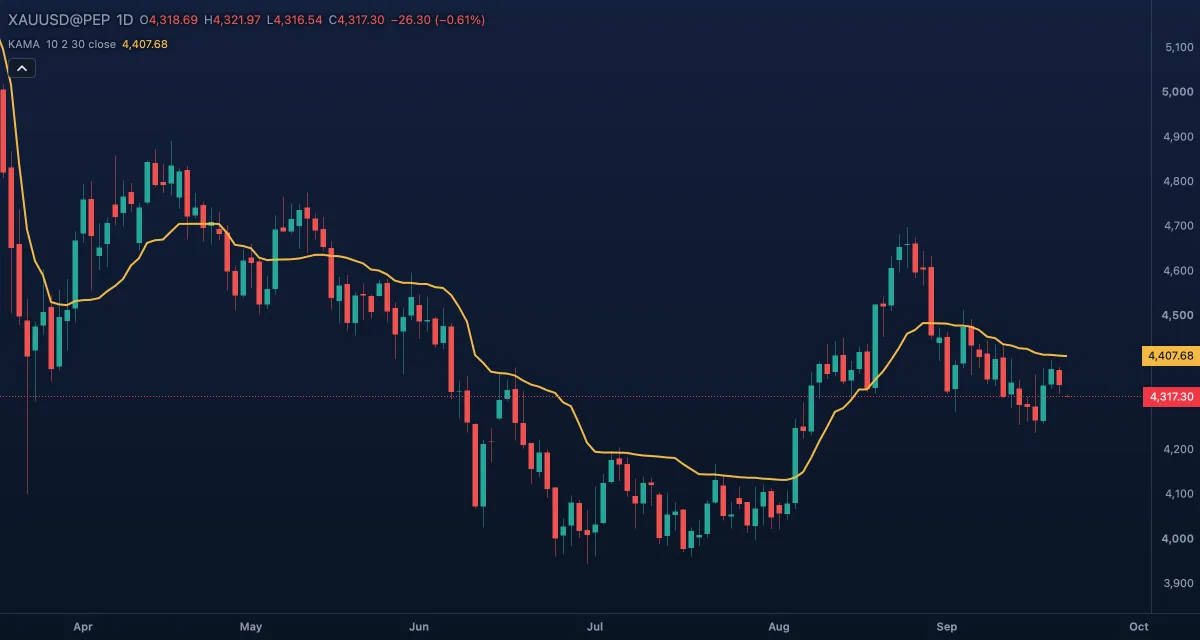
What it shows#
- KAMA — one line over the candles; the legend chip reads
KAMA 10 2 30 closeand the current value. - In a trend the line runs close to price like a fast EMA; in a sideways market it flattens and price swings around it without dragging it along.
- A flat KAMA is itself information: the market is going nowhere. A KAMA that starts to slope says a directional move has begun.
How it is calculated#
Over the Efficiency length (10 candles) the engine compares the net change in price with the sum of the candle-to-candle changes: the efficiency ratio, 1 for a straight line and near 0 for a zigzag that ends where it started. The ratio sets a smoothing speed between a fast EMA (Fast length, 2) and a slow EMA (Slow length, 30); that speed, squared, is how far the line moves toward the new Source price each candle. The line starts from the price itself and needs about four times the slow length to settle.
How traders use it#
- As a trend filter with a built-in off switch: price above a rising KAMA is an up trend; a flat KAMA means stay out, whatever price does around it.
- Crosses of price through the line count only while the line slopes; a cross through a flat line is ignored.
- As a trailing stop in trends: it keeps up with price, then stops moving when the trend pauses.
- Watch out for: the first candles of a new trend look like noise to the efficiency ratio, so KAMA is late to leave a range, and a fast, two-sided market can still drag it around.
Settings#
| Setting | Default | What it changes |
|---|---|---|
| Efficiency length | 10 | The candles over which efficiency is measured, 1 to 5000. Longer is steadier and later. |
| Fast length | 2 | The EMA length used when the market is fully efficient, 1 to 5000. |
| Slow length | 30 | The EMA length used when the market is pure noise, 1 to 5000. Larger makes the line flatter in ranges. |
| Source | Close | The price followed: Open, High, Low, Close, Mid (HL2), Typical (HLC3) or Average (OHLC4). |
| Colours and style | — | The colour, width and dash of the KAMA line. |
Example on gold#
Suppose gold has chopped between $4,260 and $4,310 for a month on the daily chart. The KAMA lies almost flat near $4,285 while the candles cross it a dozen times; a trader who respects the flat line takes none of those crosses. For example, gold then closes at $4,345, $4,360 and $4,390 on three consecutive days: the efficiency ratio jumps, the line bends up and climbs, and a long on a close above the rising KAMA, with the stop below the line, is the trade it was built for. If the line flattens again a week later at $4,400 with price slipping under it, the move is over for now and the stop does its job.
Add it to your chart#
- Click Indicators in the top strip.
- Type
kamaand click the indicator, or press Enter for the first result. - Click its chip in the legend to open the Inspector and change the settings; drag the chip to reorder; the dot hides it; × removes it.
Related#
- Exponential Moving Average — the fixed-speed average KAMA adapts between
- Average Directional Index — trend strength, for the same question
- Alerts — an alert when the price crosses the line
- Adding and tuning indicators