Detrended Price Oscillator (DPO)
What the Detrended Price Oscillator shows, why it removes the trend, the centred option, its settings on MillionChart and an example on gold.
The Detrended Price Oscillator takes the trend out of the price to leave the shorter swings — the cycles — on their own. It is the price minus a simple moving average pushed back in time by about half the average's length, in the symbol's price units. No single author is credited with it.
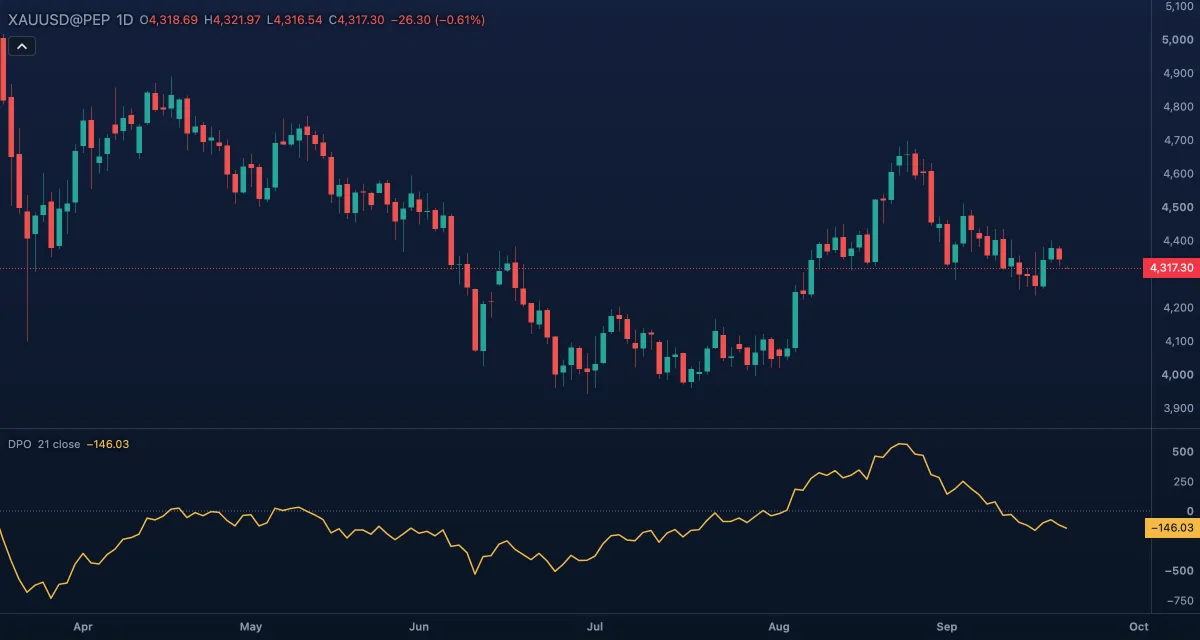
What it shows#
- DPO — one line in its own pane. Above zero the price is above the displaced average; below zero, under it. Its peaks and troughs mark the swings shorter than Length; the trend is removed, so a long rise does not push the line up.
- Zero — a dotted line at zero.
How it is calculated#
The chart takes the simple moving average of the Source over Length bars and a shift of half the length, rounded down, plus one — 11 bars for the default 21. At each bar, DPO = the source minus the average as it was 11 bars earlier. This is the common chart form and the default.
With Centred on, each bar is instead compared with the average centred on it, so the oscillator's peaks and troughs line up exactly with the price's — the classic textbook look. The cost is that the last 11 bars have no value yet, because the average they need is not complete, so the line ends short of the latest candle.
How traders use it#
- Cycle length: measure the distance from one DPO trough to the next. A regular distance, for example 20 bars, is a cycle you can project forward to expect the next low.
- Swing highs and lows: a peak far above zero marks a swing high relative to the average, a trough far below a swing low, without the trend inflating the reading.
- Zero cross as the swing turning: the price moving back above the displaced average.
- Not a trend tool: DPO says nothing about direction over its own length. Read the trend from a moving average or the price, and use DPO for the timing inside it.
- Watch out: in the default form the line is not aligned with the price's highs and lows; only the centred form is, and it stops 11 bars short. In price units, its height means something only within one symbol and timeframe.
Settings#
| Setting | Default | What it changes |
|---|---|---|
| Length | 21 | Bars of the average — cycles longer than this are removed, shorter ones remain. |
| Source | Close | Which price is measured: Open, High, Low, Close, Mid (HL2), Typical (HLC3) or Average (OHLC4). |
| Centred (shifted back n/2 + 1 bars) | Off | On: the line aligns with the price's swings but stops 11 bars before the latest candle. |
| Colours and style | — | The colours of the DPO line and the Zero line; width and dash under Look in the Inspector. |
Example on gold#
Gold has been in an uptrend on the daily chart, for example rising from $4,100 to $4,350 over two months with a pullback every few weeks. DPO (21, close) draws those pullbacks as troughs below zero about 20 bars apart, while the trend itself leaves no mark. The last trough was 17 bars ago and DPO is turning down while the price sits near $4,350: a trader who buys pullbacks expects the next low within a few bars and waits for DPO to turn up below zero, with the price still above its rising 50-bar average, before buying.
What would invalidate it: DPO continuing down well past the expected date and the price closing under the previous trough — the rhythm has changed, or the trend has.
Add it to your chart#
- Click Indicators in the top strip (on the Pro screen, press I).
- Type
dpoand click the indicator, or press Enter for the first result. - Click its chip in the legend to open the Inspector and change the settings; drag the chip to reorder; the dot hides it; × removes it.
Related#
- Momentum — the price change over n bars, also in price units
- Simple Moving Average — the average DPO subtracts
- Commodity Channel Index — the distance from the average scaled by its usual swing
- Alerts — an alert when DPO crosses zero
- Adding and tuning indicators