Donchian Channels (DC)
What Donchian Channels draw, how breakout traders read them, their setting on MillionChart and an example on gold.
Donchian Channels draw the highest high and the lowest low of the last N bars, and the line half-way between them, over the candles. Nothing is averaged: the lines are prices that actually traded. They are named after Richard Donchian, the futures trader who built trend-following rules on breaks of this channel. Other chart platforms call the same lines the Price Channel; the search finds this indicator under that name too.
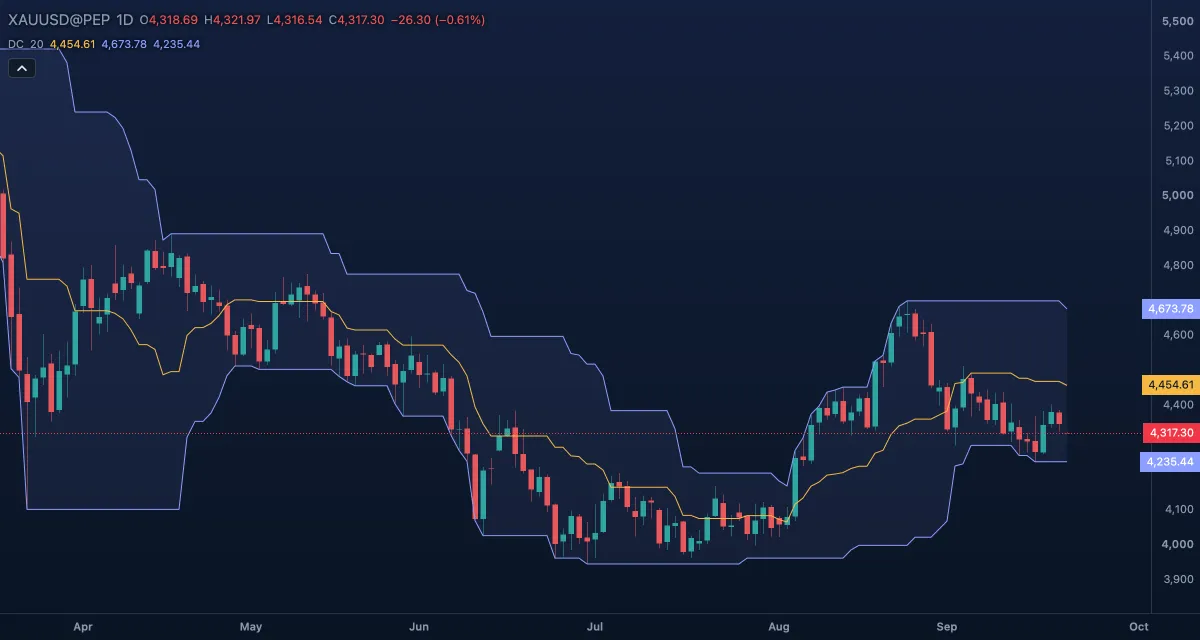
What it shows#
- Upper — the highest high of the last 20 bars, the current bar included. It steps up on a new high and steps down only when an old high leaves the window.
- Lower — the lowest low of the last 20 bars, in the same way.
- Basis — the middle of the channel.
- Channel fill — the tint between the lines; its height is the range covered over the window.
Because the current bar is part of the window, the price never goes outside the channel: a breakout shows as the price riding the upper or lower line, which steps along with it.
How it is calculated#
The upper line is the highest high over Length bars and the lower line the lowest low over the same bars; the basis is their sum divided by two. The first value appears after Length bars. Nothing is smoothed, so the lines hold still for bars at a time and then jump.
How traders use it#
- Breakout entry: a close at a new 20-bar high, with the upper line stepping up, is the classic trend-following buy; a new 20-bar low the sell. The well-known systems of the 1980s used 20- and 55-bar channels.
- Trailing exit: in a long trade, leave when the price touches the lower line of a shorter channel, say 10 bars; it rises behind the trend and locks in part of the move.
- The basis is a reference: above it the price is in the upper half of its recent range.
- A channel that has grown narrow after a long sideways stretch marks compression; the first break out of it is the one to watch.
- Watch out: in a sideways market the channel buys the top of the range and sells the bottom, again and again. A breakout entry is by design the highest price of 20 bars, so the stop must be wide, and a line can hold for 20 bars after the extreme and then drop at once.
Settings#
| Setting | Default | What it changes |
|---|---|---|
| Length | 20 | How many bars the channel looks back over. A shorter channel hugs the price and breaks often; a longer one breaks rarely and later, but with more meaning. |
| Colours and style | — | The Basis, Upper, Lower and Channel fill colours; each line's width, dash and visibility under Lines in the Inspector. |
Example on gold#
For example, gold has moved between $4,200 and $4,320 for a month, so the lines sit at those prices and the basis near $4,260. Then a daily candle closes at $4,335, a new 20-day high, and the upper line steps up with it. A breakout trader buys on that close or the next open, with the stop at the basis or at the lower line of a 10-day channel, and lets that line trail the trade.
The idea fails if the price drops back under the old top of the range, $4,320, within a few days: the breakout was false and the range goes on. This is an illustration, not a signal.
Add it to your chart#
- Click Indicators in the top strip (on the Pro screen, press I).
- Type
donchianand click Donchian Channels, or press Enter for the first result. - Click its chip in the legend to open the Inspector and change the settings; drag the chip to reorder; the dot hides it; × removes it.
Related#
- Keltner Channels — a channel built on an average and the ATR instead of the extremes
- Bollinger Bands — bands that widen and narrow with volatility
- 52-Week High and Low — the same highest high and lowest low over a year of daily bars
- Choppiness Index — whether the market is trending or chopping before you trade a break
- Alerts — an alert when the price reaches a channel line
- Adding and tuning indicators