TRIX
What TRIX measures, how its triple smoothing filters noise, how to read zero and signal crossings, its settings on MillionChart and an example on gold.
TRIX is the bar-to-bar change of a triple-smoothed exponential moving average. Three rounds of smoothing remove most short swings, so the line shows the direction of the underlying trend with little noise, at the cost of lag. Jack Hutson published it in 1983. It swings around zero in its own pane, with a signal line.
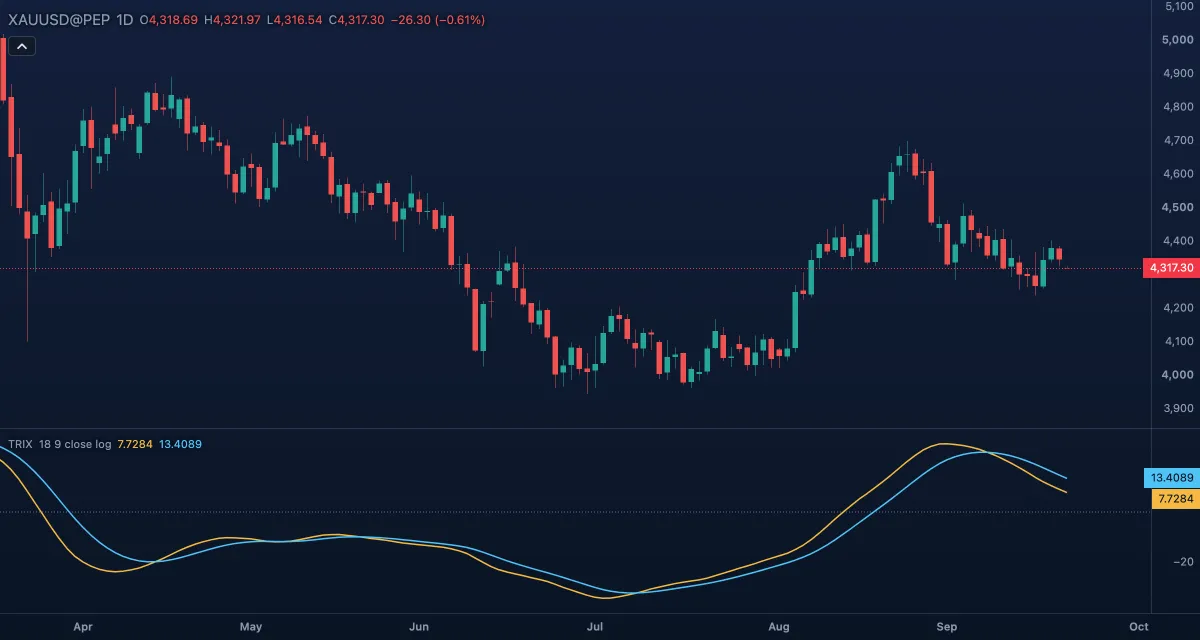
What it shows#
- TRIX (gold line): how much the triple-smoothed average moved on this bar. Above zero the smoothed average is rising; below zero, falling. By default the unit is basis points of the log of the price: a reading of 5 means the smoothed line rose by about 0.05% on that bar.
- Signal (blue line): a 9-bar EMA of TRIX. It is an addition to Hutson's original, a common chart convention.
- Zero: a dotted line at 0.
The values are small, so the pane shows four decimals; read the shape of the line rather than the number.
How it is calculated#
The natural log of the source is smoothed by an EMA of Length bars three times in a row. TRIX is the difference between this bar's triple EMA and the previous bar's, times 10,000. The Signal is an EMA of TRIX over Signal length bars. With Log of price (x10000) off, the chart smooths the price itself and shows the percent change from the previous bar; the two forms agree closely for small moves. Three chained EMAs need a long run of history before the line settles, so the start of a short chart may be empty.
How traders use it#
- Zero line: TRIX above zero means the smoothed trend is up; a crossing of zero is a trend-change signal, late but well filtered.
- Signal crossings: TRIX crossing above its signal line comes earlier than the zero crossing and says momentum is turning up; below it, turning down.
- Slope: a TRIX that is still below zero but rising toward it is the earliest hint of a turn.
- Divergence: price makes a new high while TRIX makes a lower high, so the smoothed trend is gaining less with each leg.
- Watch out for: three EMAs of 18 bars lag a lot, and the signal arrives well after the turn in price. In a sideways market the line hugs zero and its crossings mean little.
Settings#
| Setting | Default | What it changes |
|---|---|---|
| Length | 18 | Bars of each of the three EMAs. Longer is smoother and slower. |
| Signal length | 9 | Bars of the EMA of the TRIX line. |
| Source | Close | The price smoothed: Open, High, Low, Close, Mid (HL2), Typical (HLC3) or Average (OHLC4). |
| Log of price (x10000) | On | On: smooths the log of the price and shows basis points, Hutson's form. Off: smooths the price and shows the percent change. |
| Colours and style | — | The colours of the TRIX and Signal lines and of the zero line. |
Example on gold#
Suppose gold spent two months falling from about $4,400 to $4,150 on the daily chart and then starts to base, for example. TRIX is below zero, but its slope flattens and it crosses above the signal line while price is still near the lows: the smoothed trend has stopped falling. A trader who waits for confirmation might treat the later zero crossing, perhaps with price back above $4,250, as the point where the daily trend is up, and use pullbacks after that for entries. A TRIX that rolls back under the signal line before reaching zero would say the base failed.
Add it to your chart#
- Click Indicators in the top strip (on the Pro screen, press I).
- Type
trixand click TRIX. - Click its chip in the legend to open the Inspector and change the settings; drag the chip to reorder; the dot hides it; × removes it.
Related#
- MACD — two averages and a signal line, with less lag and more noise
- Percentage Price Oscillator (PPO) — MACD in percent
- Exponential Moving Average — the average TRIX smooths three times
- Alerts — an alert when TRIX crosses zero or its signal line
- Adding and tuning indicators