Pivot Highs and Lows
What the pivot high and pivot low labels mark, how a swing is confirmed, the settings on MillionChart and an example on gold.
Pivot Highs and Lows marks the swing points of the chart: a bar whose high stands above the bars around it gets a label with its price above it; a bar whose low stands below its neighbours gets one below. It is the plainest map of where the market turned, and the raw material of support, resistance, trend lines and market structure.
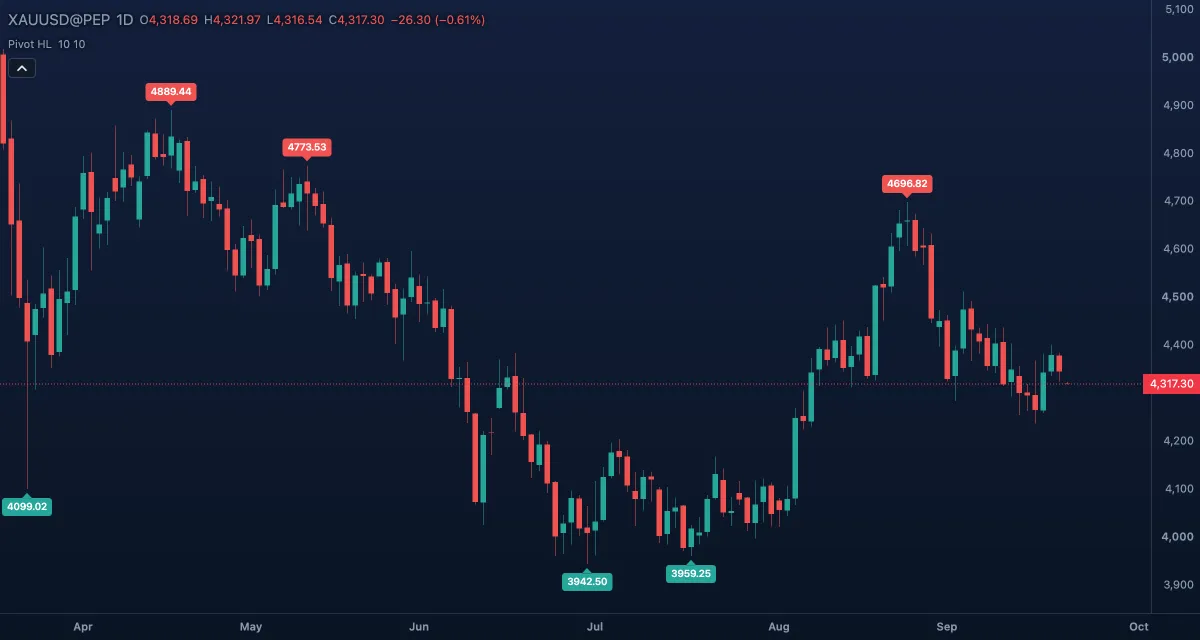
What it shows#
- Pivot high — a small red label above a swing high, with the high's price.
- Pivot low — a small green label below a swing low, with the low's price.
- A label appears only once the bars to its right have closed; the forming bar never confirms a pivot, so the newest pivot is always Right bars behind the last candle.
- Reading the labels in order gives the structure: higher highs and higher lows are an uptrend, lower highs and lower lows a downtrend.
How it is calculated#
A bar is a pivot high when its high is strictly above the highs of Left bars bars before it and Right bars bars after it; a tie disqualifies it. A pivot low is the mirror with lows. Because the bars to the right must be known, a pivot is confirmed Right bars after it happened and is then drawn back on its own bar. The defaults, 10 and 10, pick swings that stand out on any timeframe without marking every wiggle.
How traders use it#
- Support and resistance: the last pivot low is the level a bull market must hold; the last pivot high is what it must break. Draw a horizontal line at each and watch how price behaves there.
- Trend lines and channels: two pivot lows give an up trend line; see Trend line.
- Stops: a long's stop goes under the last pivot low, a short's above the last pivot high — the places where the trade is proven wrong.
- Structure: a close above the last pivot high after a run of lower highs is the earliest sign of a turn; Smart Money draws exactly these breaks for you.
- Watch out for the delay. A label is placed only Right bars later, so it can never be an entry signal on its own; it tells you where the turn was, not that it is happening. Large values find the big swings but confirm them late; small values confirm fast but mark noise.
Settings#
| Setting | Default | What it changes |
|---|---|---|
| Left bars | 10 | Bars to the left that must be lower (for a high) or higher (for a low). 1 to 500. |
| Right bars | 10 | Bars to the right that must confirm the swing. Larger: fewer, later, more reliable pivots. 1 to 500. |
| Colours and style | — | Pivot low (green) and Pivot high (red) labels: their colour and size under Lines in the Inspector. |
Example on gold#
For example, gold's daily chart shows pivot lows at $4,180 and $4,236 and pivot highs at $4,290 and $4,322: higher lows and higher highs, an uptrend. Price is now at $4,300 after a pullback from $4,322. A trend trader buys the pullback with a stop under the last pivot low at $4,236 and looks for a new pivot high above $4,322 to confirm the trend is alive. A daily close under $4,236, which would print a lower low in due course, ends the uptrend reading and the trade.
Add it to your chart#
- Click Indicators in the top strip (on the Pro screen, press I).
- Type
pivotand click Pivot Highs and Lows. - Click its chip in the legend to open the Inspector and change the settings; drag the chip to reorder; the dot hides it; × removes it.
Related#
- Zig Zag — the swings joined into legs, filtered by size instead of by bar count
- Williams Fractals — the five-bar version of the same idea
- Pivot Points — a different thing: levels calculated from the previous period's range
- Alerts — an alert when the price crosses a pivot's level
- Adding and tuning indicators