Triple Exponential Moving Average (TEMA)
What TEMA is, how three EMAs are combined to cut lag, its settings on MillionChart and a worked example on gold.
The Triple Exponential Moving Average is a fast moving average: it combines an EMA, the EMA of that EMA and the EMA of that, in a way that cancels most of the lag of a single EMA of the same length. Patrick Mulloy introduced it in "Smoothing Data with Less Lag" (Technical Analysis of Stocks & Commodities, February 1994). It is drawn over the candles in price units.
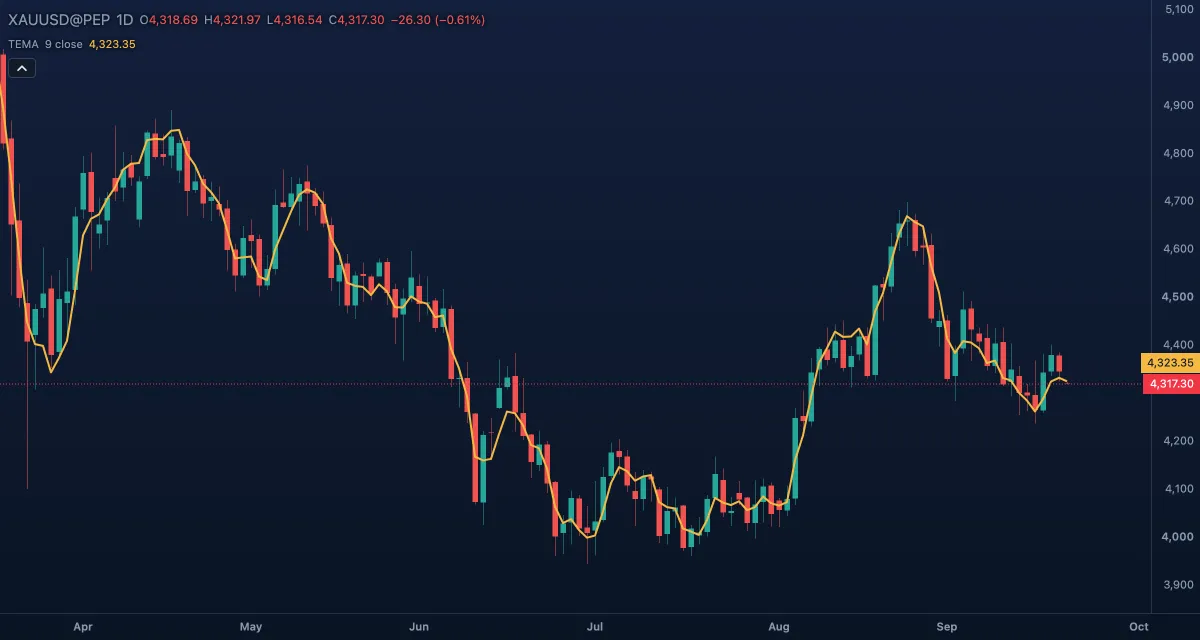
What it shows#
- TEMA — one line over the candles that turns almost as soon as price does. Its slope is the short-term direction; price on the far side of it is a short-term change of side.
- It can overshoot: after a sharp move the line may run a little beyond where price settles, then come back.
- The first value appears about three lengths into the history, because the third EMA needs the second to exist first.
How it is calculated#
E1 is an EMA of the Source over the Length; E2 is an EMA of E1 over the same length; E3 is an EMA of E2. Then TEMA = 3 × E1 − 3 × E2 + E3. Each extra smoothing adds lag, and the weighted difference subtracts it back out; the result is smoother than price but much closer to it than E1. Each EMA starts from the simple average of its first N values.
How traders use it#
- As a fast trend line: long while price closes above a rising TEMA, flat or short while it closes below a falling one.
- As the fast line of a crossover with a slower average (an EMA 21 or an SMA 50): TEMA crossing up starts the move, crossing down ends it.
- As an early warning: TEMA bending while price is still making highs says momentum is fading, before a slower average shows it.
- Watch out: it whipsaws in ranges, and the overshoot can put the line on the wrong side of price for a bar or two after a spike. Confirm with a slower average or with ADX before acting on a crossing.
Settings#
| Setting | Default | What it changes |
|---|---|---|
| Length | 9 | The length of each of the three EMAs (1 to 5,000). Larger is smoother and slower; the lag stays small for its length. |
| Source | Close | The price it follows: Open, High, Low, Close, Mid (HL2), Typical (HLC3) or Average (OHLC4). |
| Colours and style | — | The TEMA line colour. |
Example on gold#
Gold has been grinding up for two weeks and the daily TEMA (9) sits just under the candles, around $4,280 while price trades near $4,300. For example, a trader who has been long since $4,200 keeps the position while the daily close stays above the TEMA, and takes a close below it as the first exit signal, because this line turns early.
What would invalidate it as an exit: price closing back above the line the next day with the line turning up again. That is the overshoot at work: a single close through a fast average inside a trend is often just a deep pullback, so size the first exit small.
Add it to your chart#
- Click Indicators in the top strip (on the Pro screen, I does the same).
- Type
temaand click the indicator. - Click its chip in the legend to open the Inspector and change the settings; drag the chip to reorder; the dot hides it; × removes it.
Related#
- Double Exponential Moving Average — Mulloy's two-EMA version from his companion article, a little slower and calmer
- Exponential Moving Average — the building block
- Hull Moving Average — another low-lag average, built from weighted averages
- TRIX — the one-bar change of a triple-smoothed EMA, an oscillator instead of a line
- Adding and tuning indicators