Least Squares Moving Average (LSMA)
What LSMA is, how a regression line through the last candles becomes a moving average, its settings on MillionChart and an example on gold.
The Least Squares Moving Average (LSMA) draws, for every candle, the end point of the straight line that best fits the last few closes; it is also called the linear regression curve or the end point moving average. It is one line over the candles, in price units, and it sits closer to price than a simple average of the same length, because a fitted line reaches the latest price instead of trailing it.
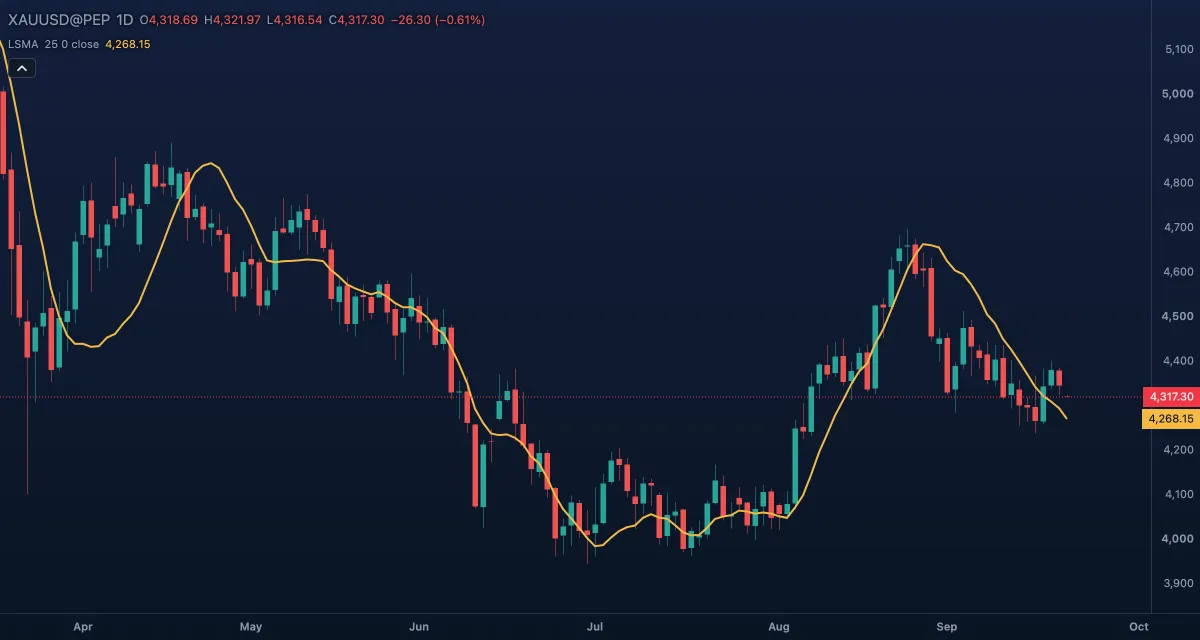
What it shows#
- LSMA — one line over the candles; the legend chip reads
LSMA 25 0 closeand the current value. - The line is where the recent trend "should" put the price now: price above it is running ahead of the trend, price below is lagging it.
- Its slope is the slope of the fitted line, and it changes sign when the best-fit trend of the last 25 candles turns.
How it is calculated#
At each candle the engine fits a straight line by least squares (the method of Legendre and Gauss) through the last Length values of the Source: the line that keeps the total squared distance to the closes as small as possible. The plotted value is that line read at the newest candle. Offset reads the same line at another point: positive, some candles back along it; negative, projected forward (−1 is one candle ahead, the time series forecast). It is a point on the fitted line, not a sideways shift of the plot.
How traders use it#
- Trend direction with little lag: the sign of the slope, and the side of price, as with any moving average but earlier.
- A cross of price through the LSMA is read as a possible change of the short-term trend; it is more sensitive than an SMA cross and gives more false alarms.
- Pullbacks: in a trend, price returning to the LSMA and holding is a common entry zone, since the line is the trend's own estimate of fair price.
- Watch out for: a straight line fitted to a curve. After a sharp turn the fit is poor for several candles and the LSMA can point the wrong way; a longer window smooths this but adds lag.
Settings#
| Setting | Default | What it changes |
|---|---|---|
| Length | 25 | How many candles the line is fitted through, 1 to 5000. Shorter follows price closely; longer is steadier. |
| Offset | 0 | Where on the fitted line the value is read, −500 to 500: 0 the newest candle, positive back, negative ahead. |
| Source | Close | The price fitted: Open, High, Low, Close, Mid (HL2), Typical (HLC3) or Average (OHLC4). |
| Colours and style | — | The colour, width and dash of the LSMA line. |
Example on gold#
Picture gold on the daily chart in a steady climb: over the last 25 candles the closes have risen from about $4,200 to $4,330, and the LSMA runs under the candles at $4,320, almost touching them. For example, a pullback to $4,300 puts price below the line while the slope stays up; a trend trader reads that as price lagging a trend still intact and looks to buy, with the invalidation a close below the line and the slope turning down. If instead the next five candles close near $4,290, the fitted line tilts over, the LSMA turns down, and the long idea is gone. The line summarises the last 25 days; it does not know the next one.
Add it to your chart#
- Click Indicators in the top strip.
- Type
lsmaand click the indicator, or press Enter for the first result. - Click its chip in the legend to open the Inspector and change the settings; drag the chip to reorder; the dot hides it; × removes it.
Related#
- Linear Regression Channel — the same fitted line over a window, drawn as a channel
- Simple Moving Average — the plain average, for comparison
- Alerts — an alert when the price crosses the line
- Adding and tuning indicators