MACD
What MACD's two lines and histogram show, how it is calculated, its settings on MillionChart and a worked example on gold.
MACD (moving average convergence divergence) measures the distance between a fast and a slow exponential moving average of the price. The distance grows when a move gains speed and shrinks when it slows. It is measured in the symbol's price units — on gold, dollars — and has no fixed range. Gerald Appel devised it in the late 1970s.
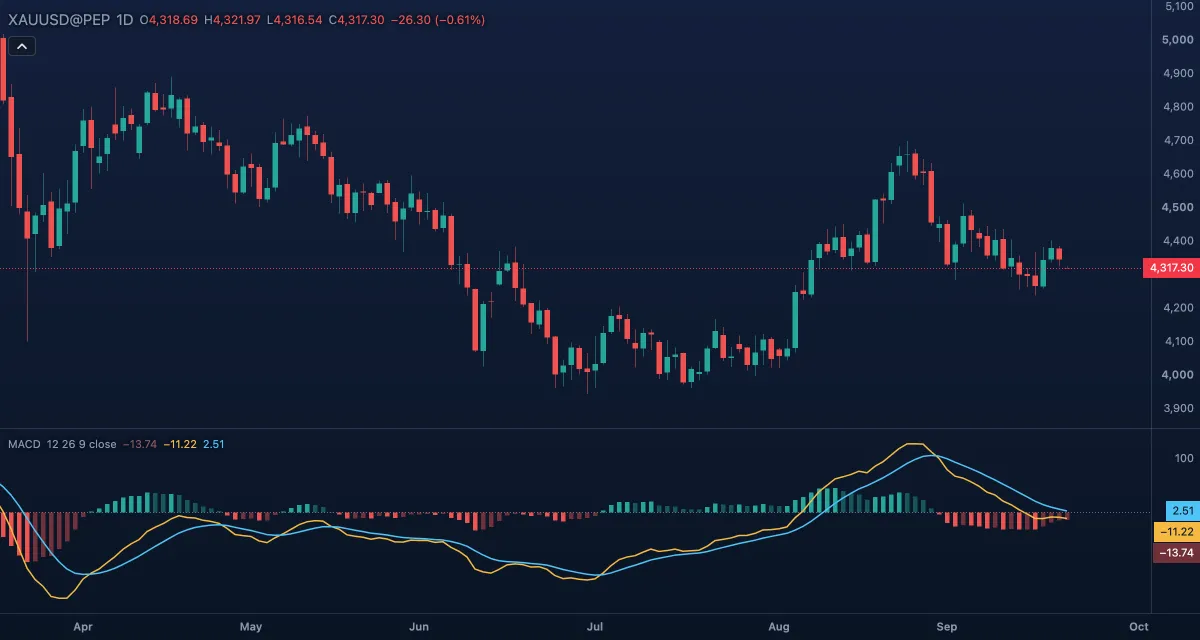
What it shows#
- MACD — the gold line in its own pane: the fast average minus the slow one. Above zero the fast average is above the slow one; below zero it is under it.
- Signal — the blue line, a smoothed copy of MACD that trails it.
- Histogram — bars from the zero line showing MACD minus Signal, the gap between the two lines. Green above zero, red below; a bar is solid when it moves away from zero and faded when it comes back towards it.
- Zero — a dotted line at zero.
How it is calculated#
The chart takes the exponential moving average (EMA) of the Source over Fast length bars and over Slow length bars; MACD is the fast EMA minus the slow EMA. Signal is the EMA of MACD over Signal length bars. The histogram is MACD minus Signal. A bar counts as falling when it is lower than the previous bar's histogram value, which with its side of zero decides the solid or faded colour.
How traders use it#
- The signal cross: MACD crossing above Signal is read as momentum turning up, crossing below as turning down; the histogram crosses zero at that moment.
- The zero cross: MACD rising above zero means the fast average has crossed above the slow one — a moving-average crossover seen from the pane.
- Histogram bars shrinking towards zero — the faded ones — warn that a cross is near.
- Divergence: the price makes a new high while MACD makes a lower high says the advance is losing speed. Confirm with the price.
- Watch out for lag and ranges: a cross comes after the turn, and in a sideways market the lines cross back and forth with no move to show for it. MACD is in price units, so its height cannot be compared across symbols; the Percentage Price Oscillator says the same in percent.
Settings#
| Setting | Default | What it changes |
|---|---|---|
| Fast length | 12 | Bars of the fast EMA. Shorter makes MACD react sooner and cross more often. |
| Slow length | 26 | Bars of the slow EMA. Longer follows a longer trend. |
| Signal length | 9 | Bars of the Signal EMA. Shorter brings the crosses earlier, with more false ones. |
| Source | Close | Which price feeds the averages: Open, High, Low, Close, Mid (HL2), Typical (HLC3) or Average (OHLC4). |
| Colours and style | — | The colours of MACD, Signal and the four histogram states (above or below zero, rising or falling); widths and dash under Look in the Inspector. |
Example on gold#
Gold slips, for example, from $4,400 to $4,250 over three weeks on the daily chart. MACD (12, 26, 9) is below zero and the histogram is solid red, growing with the fall. Then the red bars shrink and turn faded while the price holds near $4,260: the fall is slowing. When MACD crosses above Signal, at about −8 dollars, a trader looking for the turn has the first sign; MACD rising through zero a week or two later would confirm it.
What would invalidate it: MACD crossing back under Signal before reaching zero, with the price closing below $4,250. That is a failed turn, and the downtrend is still on.
Add it to your chart#
- Click Indicators in the top strip (on the Pro screen, press I).
- Type
macdand click the indicator, or press Enter for the first result. - Click its chip in the legend to open the Inspector and change the settings; drag the chip to reorder; the dot hides it; × removes it.
Related#
- Percentage Price Oscillator — MACD in percent, comparable across symbols
- Exponential Moving Average — the averages MACD is built from
- RSI — a bounded oscillator with fixed levels, a usual companion
- Alerts — an alert when MACD crosses zero
- Adding and tuning indicators