Order Book Heatmap
What the Order Book Heatmap shows, where its data comes from, which symbols have one, its settings on MillionChart and a worked example on the gold perpetual.
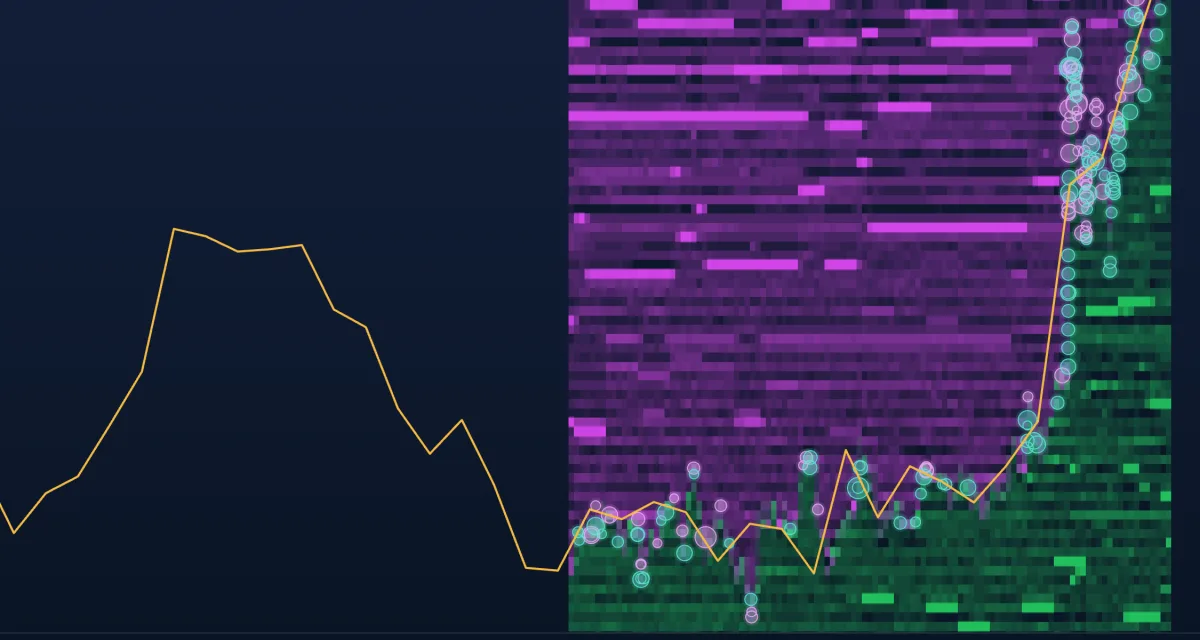
The Order Book Heatmap draws the exchange's resting limit orders over time: every price level that holds bids or asks becomes a horizontal band behind the candles, brighter where more size is waiting, and every sizeable trade becomes a bubble. It is the one indicator on MillionChart that is not computed from the bars at all: the server samples a public order book once a second and the chart draws what it recorded.
What it shows#
- Bands — resting bids below the price in teal, resting asks above it in violet. Each band is one price level of the book; the brighter it is, the more contracts are waiting there. A band that stands for minutes is a wall; one that vanishes just before the price arrives was pulled.
- Bubbles — the largest trades of each column, placed at their time and price and sized by volume: teal when a buyer took the ask, violet when a seller hit the bid.
- Columns — the book is sampled every second. Zoomed in, every column is one second; zoomed out, columns are averaged to 10 seconds or 60 seconds so the picture stays readable.
- The pill — a small label at the top right of the chart says whether the book is live, history only, or not recorded for this symbol, and which book it is when the chart reads another market's.
Where the data comes from#
The chart's brokers carry quotes, not a book, and spot gold trades over the counter with no public order book at all. So the heatmap reads the public market-data streams of an exchange's perpetual contracts: the book out to a few hundred levels a side and every trade with the side that took the price. The gold perpetual XAUUSDT.P is the closest public picture of gold's order flow; it trades around the clock and its price can differ from spot gold by a few dollars, most of all while spot gold is closed. On the brokers' gold, bitcoin and ether symbols (XAUUSD, BTCUSD, ETHUSD) the chart shows the perpetual's book aligned to its own price: every column is moved to the chart's price at that moment, so a wall sits at its real distance from the price you trade, and the two markets' price difference drops out. Sizes are in contracts of the base asset (ounces for gold, bitcoin for BTC).
How traders use it#
- Look for bright bands close to the price: large resting orders show where the move may slow. A band that has stood for a while says more than one that just appeared.
- Watch what happens when the price reaches a wall. Bubbles hitting it while it holds mean the liquidity was real; a wall that disappears before the price gets there was never meant to be filled.
- Read the bubbles together with the bands: heavy buying into a violet band while the price stays put means sellers are absorbing it.
- Check the clock. The same wall means something different at the New York open than on a Saturday afternoon, when the perpetual trades thinly and spot gold is closed.
Settings#
| Setting | Default | What it changes |
|---|---|---|
| Scale | Log | How size maps to brightness: Log shows the small levels too, Linear lets only the big walls stand out. |
| Intensity | 1 | Multiplies the brightness (0.25–4). |
| Bubbles | On | Draws the trades. |
| Min trade | 0 | The smallest trade drawn as a bubble, in contracts; 0 picks a size from the trades in view. |
| Colours | — | The bid and ask bands and the buy and sell bubbles. |
Example on the gold perpetual#
For example, on 1-minute candles the gold perpetual sits at $4,106 after a sharp rise, and a bright violet band has stood at $4,112 for ten minutes while the bands below it come and go. The price climbs into it; large teal bubbles print at $4,111.9 for two minutes and the band only gets brighter — buyers are being absorbed. A trader who was long takes that as the place to tighten the stop or take the trade off. Had the band vanished the moment the price reached $4,111, the reading would have been the opposite: a wall that was pulled, with nothing left to stop the move.
Add it to your chart#
- Open gold, bitcoin or ether:
XAUUSD,BTCUSDorETHUSDof any broker (the perpetual's book, aligned), or the perpetuals themselves,XAUUSDT.P,BTCUSDT.PandETHUSDT.P. - Click Indicators in the top strip (on the Pro screen the key is I), type
order bookand click the indicator. - Click its chip in the legend to open the Inspector and change the settings; the dot hides it; × removes it.
Related#
- Volume Footprint — buying and selling at every price inside each candle
- Net Volume — each bar's volume with the sign of its close
- Volume Profile — where the volume traded, over a session
- Alerts — an alert at the price of a wall
- Adding and tuning indicators